Hydroscopic Powders: A Microcalorimetric Assessment of Cement
M. Shaflq J. Suurkuusk
2277 Thermal Activity Monitor
Materials Science
TA Instruments, 109 Lukens Drive, New Castle, DE 19720, USA
Introduction
The composition of cement, as with other widely used mixtures of hydroscopic powders can effect the rate of interaction with water. Cements are composed of a number of such highly hydroscopic compounds which all function in a manner as to effect the rate of reaction and consequently the curing process.
Traditional methods of analysis of the effect of different constituents on the rate of curing are time consuming and subjective. Batch to batch variations can often came the Loss of much of the rigidity and strength of the cement. It is therefore essential that rapid and reliable methods of determination of the quality of cement mixtures be found which can in addition give a continuous record of the kinetics of the reaction.
Experimental
A 2277 multichannel Thermal Activity Monitor (TAM) of the isothermal heat conduction type was used for these studies. The TAM can be equipped with up to four different calorimetric units each wiih a combination of functions. A titration vessel placed in the calorimetric unit was used for the addition of water to the cement mixture.
In experiments for which the heat of hyd ration was measured, the cement samples (l00mg) were placed in the titration ampoule which had previously been lightly coaled wiih grease and then lowered into the measuring position. Humidified air was pumped through the ampoule in order to obtain an equilibrium of water vapour in the ampoule chamber. Once a steady state was achieved, 50μl of water was injected into the ampoule and stirred for 1 min by means of a stirring mechanism inside the litration vessel. Thus, the initial heat of hydration as well as the curing rate was recorded.
The second series of experiments involved analysing different batches and compositions of cement. 200mg samples were mixed thoroughly with water outside the TAM in a ratio of 2:1. They were then transferred to disposable glass ampoules and lowered into the measuring position. Measurements commenced 35 min after mixing with water.
Results and Discussion
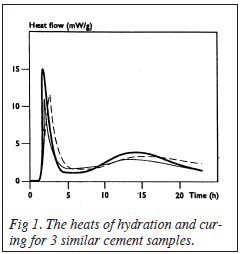
Figure 1 shows the beats of hydration of the different cement samples followed by the heats from the curing process. Large differences are observed in the initial heats of hydration. However, the actual curing curves follow a similar pattern for each of the samples. Hence, the area under the heat flow curve can be used to determine the total heats of reaction of the cements.

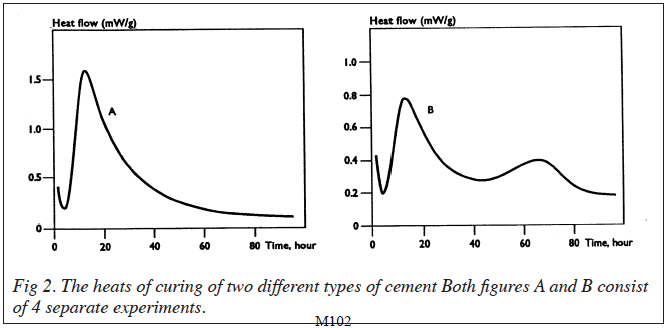
Results for the second series of experiments in which the samples were mixed with water outside the TAM, are shown in fig 2. A high degree of reproducibility was obtained with each type of cement. Essentially the cements could be classified into two groups according to the types of heat flow profiles observed. One series of samples showed an initial high heat output which tailed off slowly after 90h. The second series also showed the initial rise in heat output which was not as high as in the first series. This was followed by a second increase in heat output which reached a maximum after approximately 65-70h. The data therefore shows that apart from the initial heat of hydration of the cement samples outside the TAM, there follows a one step reaction in which the cement components react to form the matrix for one series, and a two step reaction for the other. Alternatively, the second heat output could be suggested to be as a result of a delay in the initiation of that particular reaction.

Conclusion
The results therefore show that small variations in composition of cement affect the
type of heat-flow curve obtained from which the total heat of reaction can be calculated. It is also apparent that the kinetics of the curing reaction including the rate of hydration of cement can be followed. Similarly it is possible to determine the effects of retarding or accelerating agents on the rate of curing.
